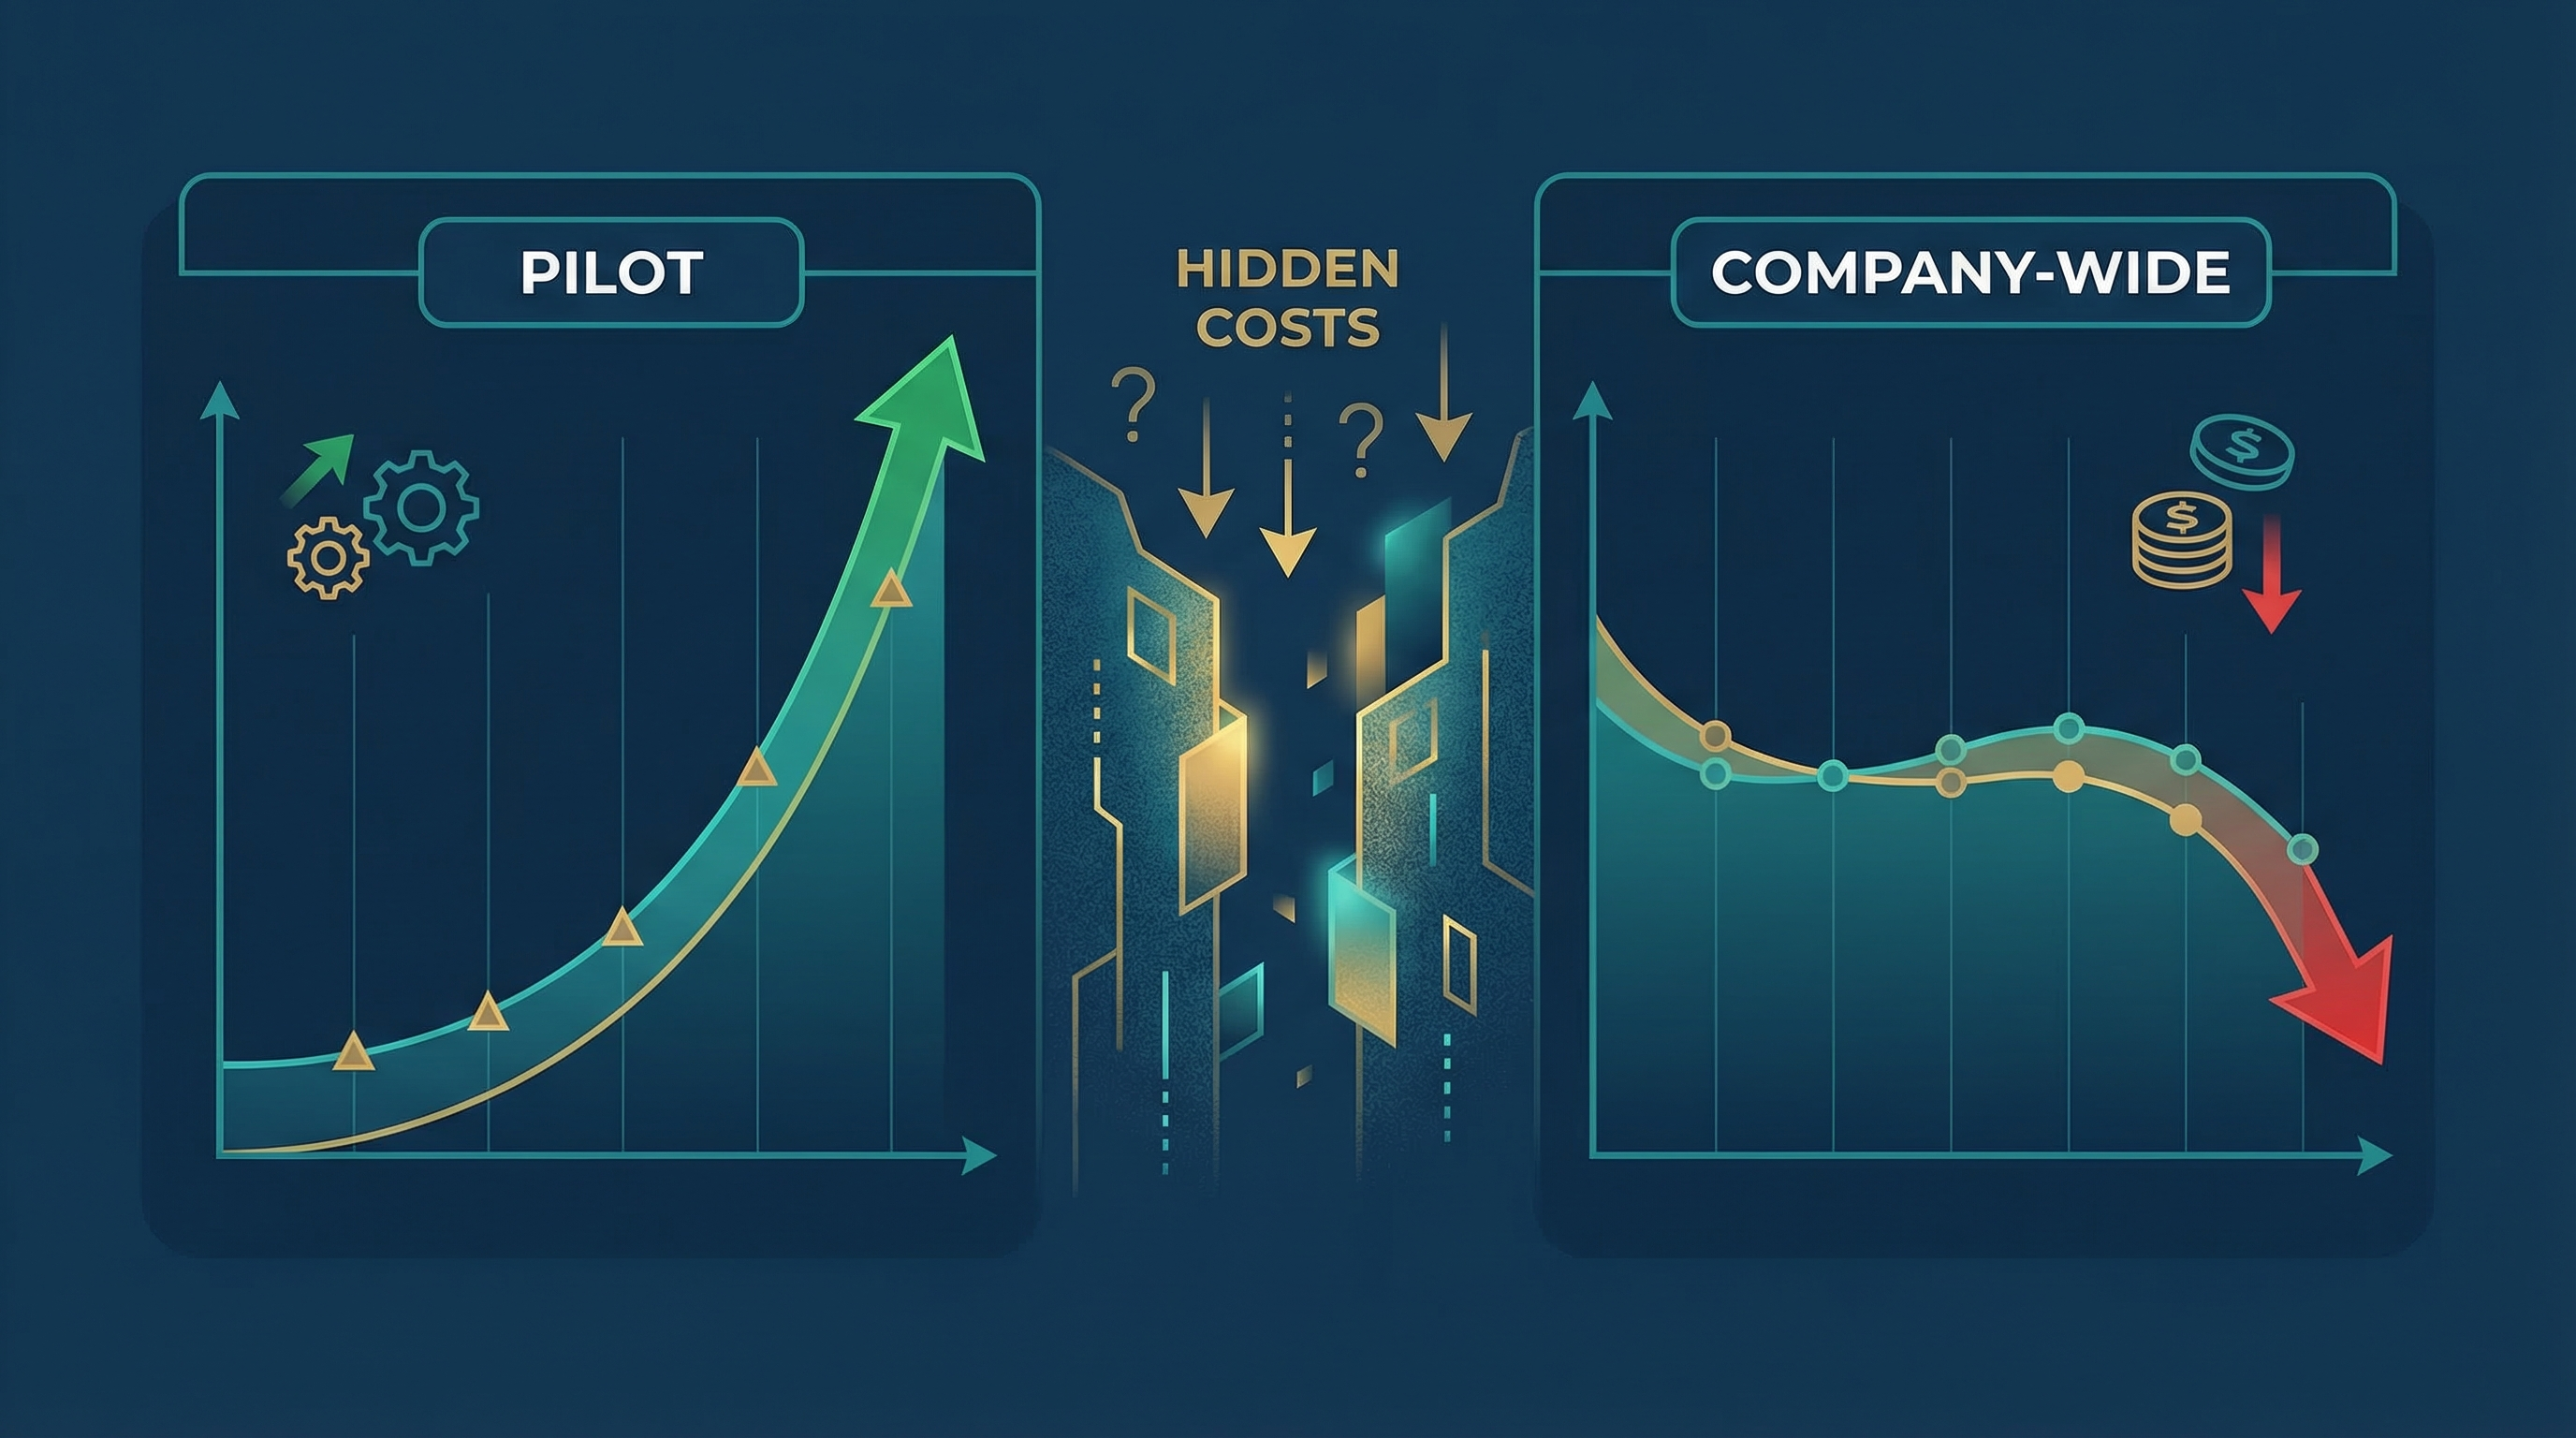
The Pattern
Pilot results:
- Meeting notes automated → 3 hours/week saved
- Email drafts generated → 50% faster
- Document summaries → 90% time reduction
Company-wide results:
- Adoption stalls at 20%
- Hidden costs eat the savings
- ROI negative within 6 months
The Numbers
| Metric | Value |
|---|---|
| Pilots that fail to scale | 95% (MIT, 2025) |
| Organizations stuck in pilot/POC | 68% |
| AI embedded in core processes | 7% |
| Users reporting significant downsides | 92.4% |
The uncomfortable truth:
Pilot success ≠ Company-wide success.
Why Pilots Succeed at Scale But Fail in Production
Reason 1: Hidden Costs
Pilot:
Tool cost: $20/user/month
Time saved: 3 hours/week
ROI: Obviously positive
Company-wide:
Tool cost: $20/user/month × 1000 users = $20,000/month
Integration: $50,000 one-time
Training: $30,000
Change management: $40,000
Monitoring/support: $10,000/month
Total Year 1: $400,000+
The hidden costs:
| Cost Category | Often Missed | Real Impact |
|---|---|---|
| Integration | APIs, data migration | 2-3x tool cost |
| Training | Onboarding, support | 1-2x tool cost |
| Change management | Adoption campaigns | 1-2x tool cost |
| Monitoring | Hallucations, drift | Ongoing |
| Rework | AI errors, overrides | Hidden productivity loss |
Reason 2: The Champion Problem
Pilot:
- Hand-picked enthusiastic users
- Direct executive sponsor
- Clear success metrics
- Immediate feedback loops
Company-wide:
- Skeptical users included
- Sponsor distracted
- Metrics unclear
- Feedback loops broken
The data:
42% of AI projects get scrapped due to loss of executive sponsorship (S&P Global, 2025).
Reason 3: Wrong Metrics
Pilot metrics:
- Time saved per task
- User satisfaction scores
- Feature adoption rate
Business metrics:
- Revenue impact
- Cost reduction
- Error rate reduction
- Capacity released
The gap:
"We saved 3 hours per person per week"
≠
"We improved revenue by 5%"
Reason 4: The Scale Complexity Curve
| Users | Complexity Factor | Hidden Costs |
|---|---|---|
| 10 | 1x | Minimal |
| 50 | 3x | Training, support |
| 200 | 6x | Change management, governance |
| 1000 | 10x+ | Full enterprise stack |
The 3-Lens ROI Framework
Lens 1: Productivity
Question: How much time was actually saved?
Measure:
- Time-to-task-completion (before vs after)
- Tasks completed without human intervention
- Capacity released (what else got done?)
Pitfall: Measuring “time saved” without tracking “capacity released” misses the value.
Lens 2: Accuracy
Question: Did quality improve or degrade?
Measure:
- Error rate (before vs after)
- Override rate (how often humans fix AI output)
- Rework time (correcting AI mistakes)
Pitfall: Ignoring override rates inflates productivity gains.
Lens 3: Value-Realization Speed
Question: How quickly do benefits appear?
Measure:
- Time to first value
- 90-day adoption share
- Payback period
Pitfall: Long payback periods destroy ROI in fast-changing tech environments.
The Risk-Adjusted ROI Formula
Standard ROI
ROI = (Benefit − TCO) / TCO
Risk-Adjusted ROI
ROI = (Benefit − TCO) × Confidence Factor

Where:
Confidence Factor = 1 − (hallucination_rate + override_rate + data_leak_risk + model_drift_risk)
Example Calculation
Scenario: AI meeting notes for 100 users
| Metric | Value |
|---|---|
| Time saved | 3 hours/user/week |
| Hourly cost | $50 |
| Weekly benefit | $15,000 |
| Annual benefit | $780,000 |
| Tool cost | $2,400/month ($28,800/year) |
| Integration + training | $100,000 |
| Monitoring + support | $24,000/year |
| Total Year 1 TCO | $152,800 |
Standard ROI:
($780,000 − $152,800) / $152,800 = 410%
But:
- Override rate: 20% (humans correct 20% of AI output)
- Hallucination rate: 5%
- Rework time: 30 minutes/user/week
Adjusted benefit:
Time saved: 3 hours − 0.5 hours (rework) = 2.5 hours
Effective benefit: $650,000/year
Confidence factor: 1 − 0.20 − 0.05 = 0.75
Risk-adjusted benefit: $650,000 × 0.75 = $487,500
Risk-adjusted ROI:
($487,500 − $152,800) / $152,800 = 219%
Still positive—but 48% lower than the initial calculation.
The Framework: From Pilot to Scale
Step 1: Baseline Before Pilot
| Metric | Before AI | Target |
|---|---|---|
| Time per task | X hours | Y hours |
| Error rate | Z% | W% |
| Cost per outcome | $A | $B |
Don’t start without a baseline.
Step 2: Track Hidden Costs During Pilot
| Cost Category | Pilot Estimate | Actual | Scale Multiplier |
|---|---|---|---|
| Tool licenses | $ | $ | Users × cost |
| Integration | $ | $ | 2-3x for scale |
| Training | $ | $ | 1-2x for scale |
| Change management | $ | $ | Often missed |
| Support | $ | $ | Ongoing |
Step 3: Calculate Risk-Adjusted ROI
1. Calculate time saved
2. Subtract rework time (override × time to fix)
3. Apply confidence factor
4. Subtract TCO
5. Divide by TCO
Step 4: Define Scaling Criteria
Only scale when:
| Criterion | Threshold |
|---|---|
| Risk-adjusted ROI | > 100% |
| Override rate | < 15% |
| User adoption (90 days) | > 60% |
| Executive sponsor confirmed | Yes |
| Change management budget | Allocated |
Quick Wins: Start Here
| Task | Tool | Time Saved | Risk |
|---|---|---|---|
| Meeting notes → Summary | Otter/MeetGeek | 30 min/meeting | Low |
| Email drafting | ChatGPT/Claude | 50% faster | Low |
| Document summarization | Notion AI/Claude | 90% faster | Low |
| Lead routing | Zapier + AI | Hours → Minutes | Medium |
| Report generation | AI + Zapier | Hours → Minutes | Medium |
Start with low-risk, high-visibility tasks.
Key Takeaways
The Pilot-Scale Gap
Pilot: Controlled environment, enthusiastic users, clear metrics
Scale: Messy reality, skeptical users, hidden costs
The Fix
- Baseline before you start
- Track hidden costs during pilot
- Calculate risk-adjusted ROI
- Define scaling criteria before scaling
The Formula
Real ROI = (Benefit − Rework − TCO) × Confidence Factor
Sources
- MIT Report: 95% of GenAI Pilots Failing (Fortune)
- Industrial AI Pilot: 68% Can’t Scale (HiveMQ)
- AI Project Failure Statistics 2026 (Pertama Partners)
- Why 95% of Enterprise AI Pilots Fail (Kendall AI)
- Lenny’s Newsletter Survey (1,750 respondents)
Related Posts
- The Missing Link: Why 42% of AI Projects Get Scrapped — Executive sponsorship matters
- The AI Productivity Paradox — Why 95% see zero ROI
Your pilot worked because you controlled the variables. Scale fails because you don’t. The fix isn’t better AI—it’s better ROI math.