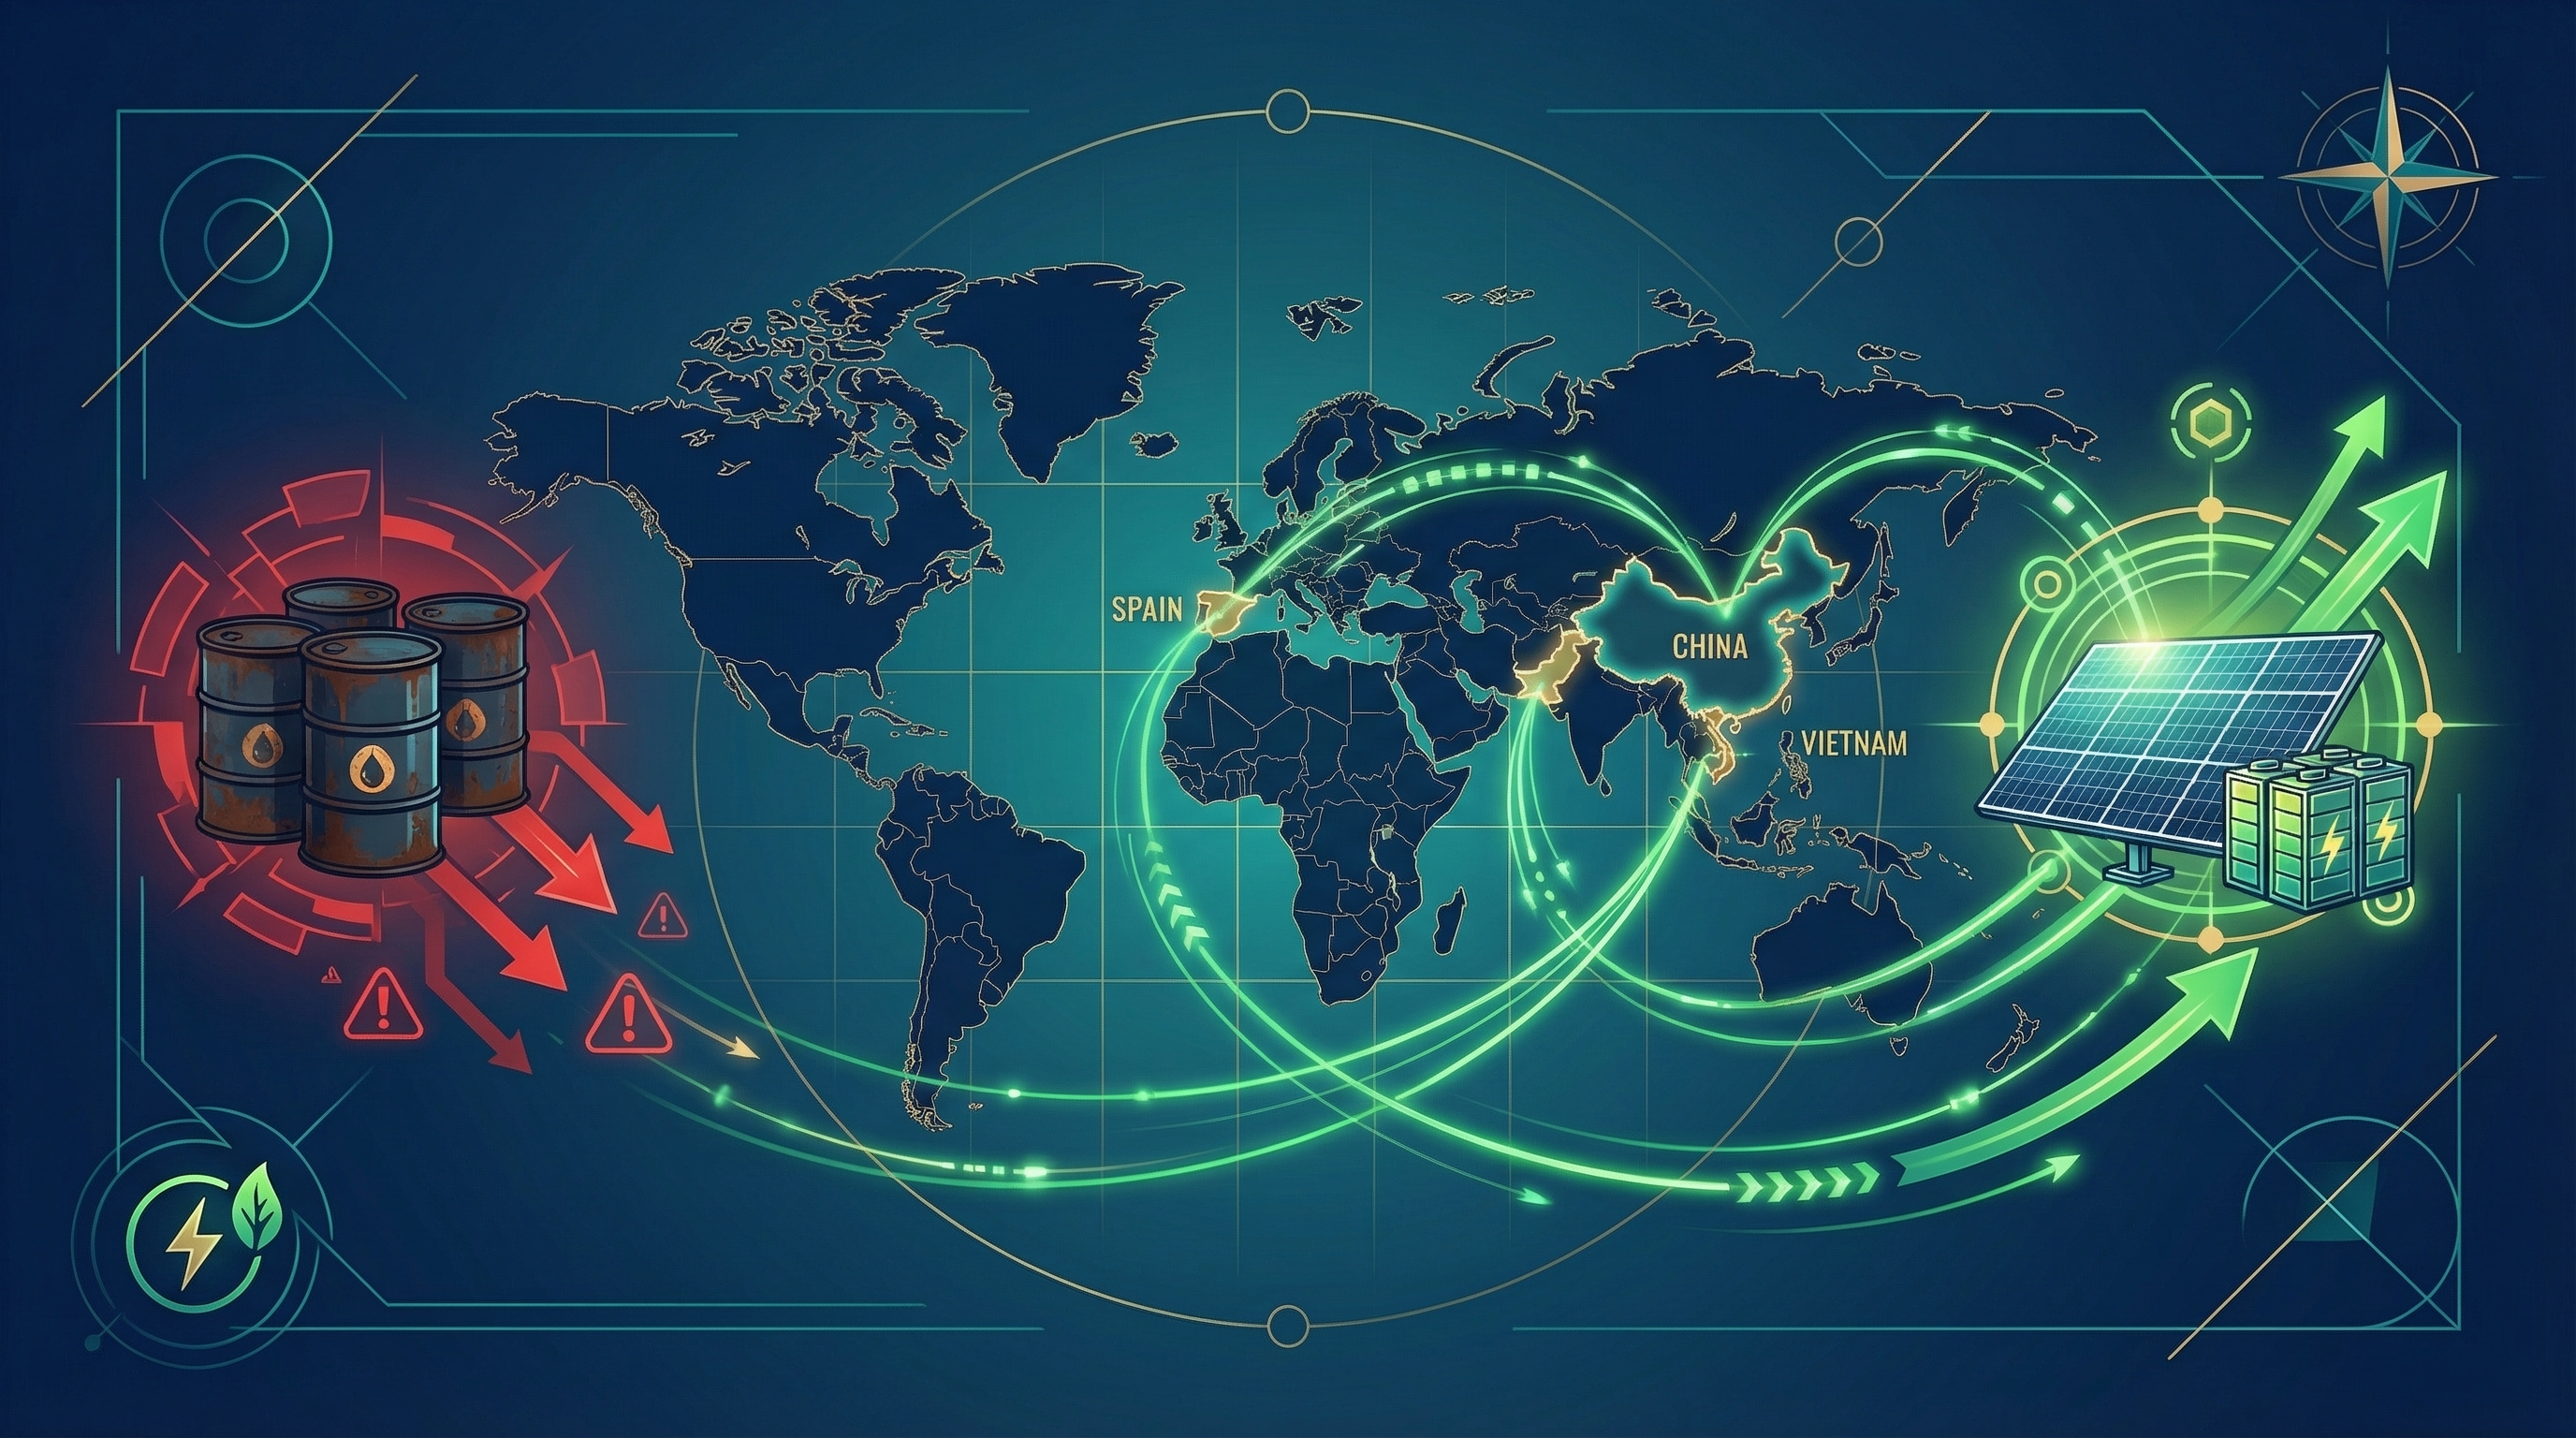
The Geopolitical Signal
Iran war impact:
| Event | Consequence |
|---|---|
| Strait of Hormuz disruption | Oil/gas prices up 55% |
| Energy supply uncertainty | Nations reassessing fossil fuel dependence |
| UN climate chief statement | “Sunlight doesn’t depend on narrow shipping straits” |
The insight:
Energy security arguments are now bipartisan.
Previously: Renewables = climate policy Now: Renewables = national security
Who’s Winning: Country-Level
🇵🇰 Pakistan: The $120B Pivot
| Metric | Value |
|---|---|
| Fossil fuel savings (2020-2026) | $120 billion |
| Projected 2026 savings | $63 billion |
| Strategy | Solar + battery scale-up |
How they did it:
2020: Energy crisis, massive LNG imports
2021-2025: Aggressive solar/battery deployment
2026: $120B savings, reduced LNG dependence
Key lesson: Fast renewable deployment can offset fossil fuel exposure faster than expected.
🇪🇸 Spain: From Highest to Lowest
| Metric | 2019 | 2026 |
|---|---|---|
| Electricity prices | Highest in Europe | Lowest in Europe |
| Gas influence on prices | High | Reduced 75% since 2019 |
| Coal dependence | 25% (10 years ago) | Coal-free since Aug 2025 |
The transformation:
2015: 25% coal, gas-dominated pricing
2019: Highest electricity prices in Europe
2025: Coal-free
2026: Lowest electricity prices in Europe
Key lesson: Renewables reduce exposure to gas price volatility—even during geopolitical crises.
🇨🇳 China: The EV Dominance
| Metric | Value |
|---|---|
| EV + hybrid sales | More than rest of world combined |
| Oil dependence trajectory | Declining |
| Renewable capacity | World’s largest |
The strategy:
1. Build EV manufacturing dominance
2. Deploy renewables at scale
3. Reduce oil import exposure
Key lesson: Transportation electrification = energy security hedge.
🇻🇳 Vietnam: Ethanol Acceleration
| Metric | Status |
|---|---|
| Ethanol-blended gasoline | Full transition accelerated |
| Timeline | Ahead of original plan |
The signal: Even fossil fuel transitions (not full electrification) are accelerating.
Why Batteries, Why Now
The $25B Market Signal
| Metric | Value |
|---|---|
| US BESS deployment 2026 | 70 GWh / 35 GW |
| Investment | $25.2 billion |
| Global BESS by 2034 | 1,545 GW |
| Market size by 2035 | $123B+ |
The AI Connection
Data center power demand → 100 GW by 2030
Grid connection delays → 3-5 years
Batteries → Deploy in 12-18 months
The math:
| Solution | Timeline | Function |
|---|---|---|
| New power plants | 5-10 years | Generate power |
| New transmission | 7-10 years | Move power |
| Batteries | 12-18 months | Optimize existing grid |
Who’s Winning: Company-Level
Canadian Solar (CSIQ): The 2.5 GWh Deal
| Metric | Value |
|---|---|
| Deal size | 500 MW / 2,493 MWh DC |
| Customer | US major utility (data center focus) |
| Product | ~500 SolBank 3.0 containers |
| Delivery | March-July 2027 |
| Backlog | $3.1B |
The signal: Data centers are driving utility-scale battery demand.
Eos Energy: The $23.6B Pipeline
| Metric | Value |
|---|---|
| Backlog | $701.5M |
| Commercial pipeline | $23.6B (+64% YoY) |
| Technology | Zinc-based batteries |
The signal: Pipeline growth indicates sustained demand visibility.
Other Players to Watch
| Company | Focus | Signal |
|---|---|---|
| Fluence (FLNC) | Storage systems + software | Pure-play storage |
| Stem (STEM) | AI-powered storage optimization | Software edge |
| NextEra (NEE) | Utility + storage integration | Integrated model |
Investment Framework
🔴 Tailwinds
| Factor | Impact |
|---|---|
| Iran war energy shock | Accelerates renewable transition |
| Data center demand | 100 GW by 2030 |
| Grid constraints | Batteries = faster solution |
| Policy support | Illinois 3GW mandate, others following |
🟡 Watch Points
| Risk | Mitigation |
|---|---|
| Supply chain constraints | Monitor cell manufacturing capacity |
| Policy volatility (US) | Focus on data center-driven demand |
| Margin pressure | Canadian Solar net income -54.6% YoY |
🔵 Sector Picks
| Category | Why | Examples |
|---|---|---|
| Best positioned | Battery integrators | e-STORAGE, Fluence |
| Infrastructure plays | Project developers | Utilities with storage |
| Technology enablers | Grid intelligence | VPP platforms |
Key Numbers
| Metric | Value |
|---|---|
| Pakistan solar savings | $120B (2020-2026) |
| Spain price flip | Highest → Lowest in Europe |
| US BESS 2026 | 70 GWh / 35 GW / $25.2B |
| Global BESS by 2034 | 1,545 GW |
| BESS market by 2035 | $123B+ |
| Canadian Solar backlog | $3.1B |
| Eos pipeline | $23.6B |
The Takeaway
Geopolitical shock → Energy security realization → Renewable acceleration
Iran war proved:
• Fossil fuel supply chains are fragile
• Renewables = energy independence
• Batteries = fastest deployment option
Who’s winning:
| Level | Winners |
|---|---|
| Countries | Pakistan, Spain, China, Vietnam |
| Companies | Battery integrators, storage developers |
| Investors | Those positioned before the acceleration |
Sources
- Pakistan solar savings data
- Spain electricity price transformation
- US BESS deployment forecasts
- Canadian Solar deal announcement
- Eos Energy pipeline data
Related Posts
- AI Needs Power: Batteries vs Nuclear — Two solutions for data center power
- Rising Real Estate Sectors — Data centers meet real estate
Iran war didn’t create the renewable transition. It just made the energy security argument undeniable. The question isn’t whether to transition—it’s who captures the $123B market.